
Visual Analytics: Actionable Insights to Convey Stories
Introduction
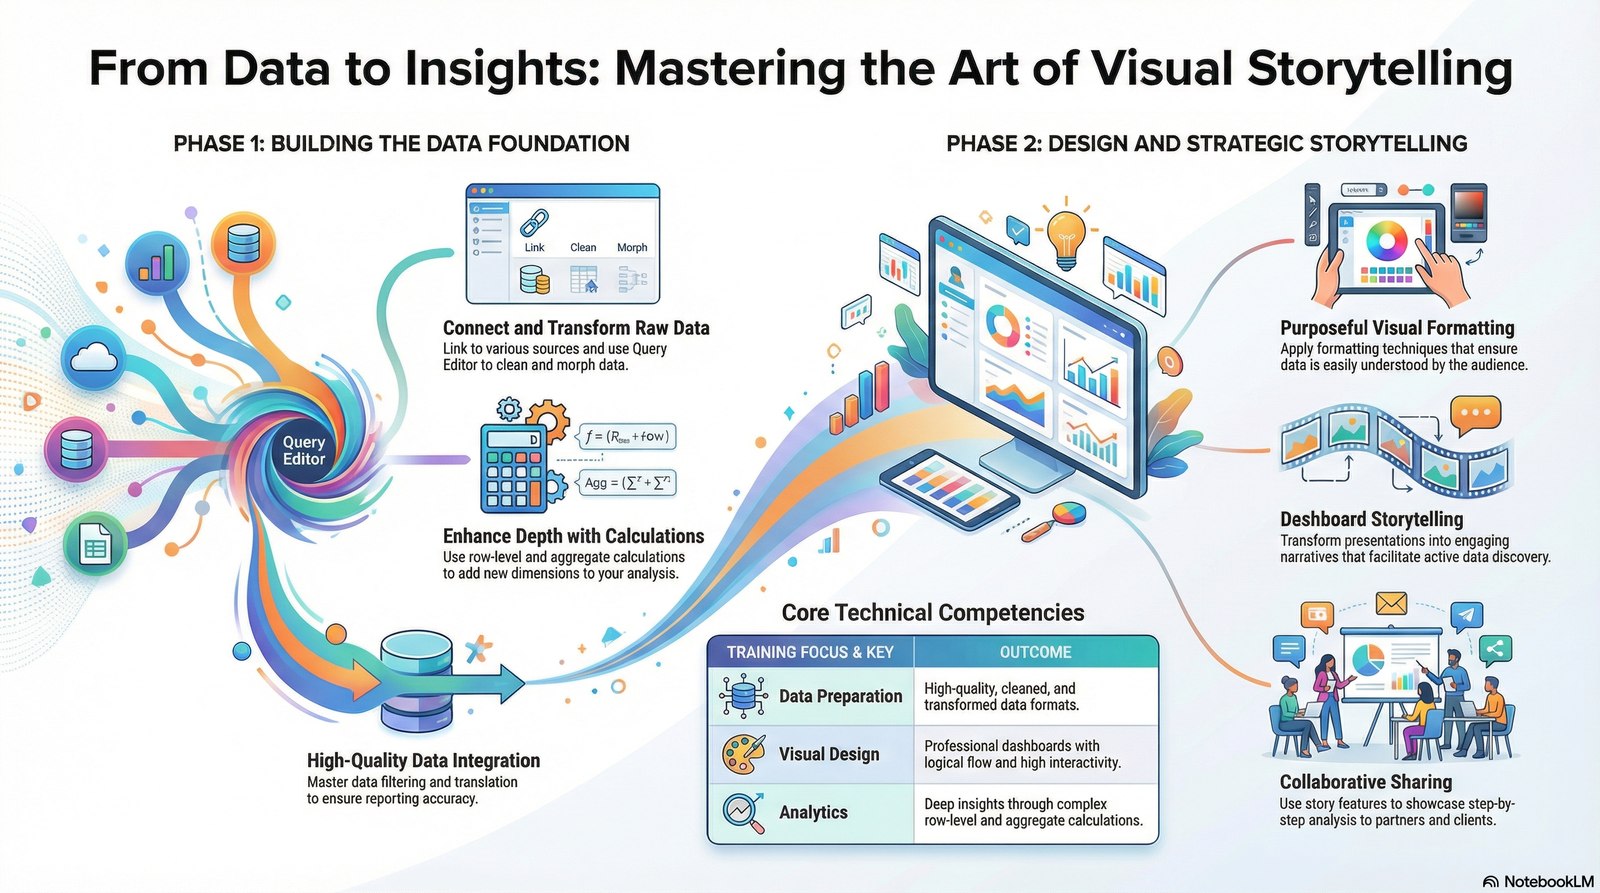
This course introduces you to a powerful visual analysis. Power BI & Tableau is an easy to use tool that can be used to turn data into actionable insight so that you can convey stories to yourself and others through the use of highly interactive visualisations. Visual Analytics allows users to access reports and dashboards using familiar tools and devices. This two-day course is designed for the beginner and will help you understand and use the basic techniques for creating visualisations and combining them in interactive dashboards.
Introduction
Programme Outline
What’s inside this outline?
This outline provides a structured overview of the programme’s objectives, key topics, and learning flow. It is intended to help you assess relevance and suitability before engaging further.
Resources
Visual Analytics: Actionable Insights to Convey Stories
Interested in this programme?
Explore how this programme and its related resources can support your learning goals, organisational needs, or professional development.
- ✔ Comprehensive programme content
- ✔ Supporting articles and infographics
- ✔ Practitioner-led insights
- ✔ Suitable for multiple learning contexts
Or email us at training@hba.com.my